Data Project Checkpoint
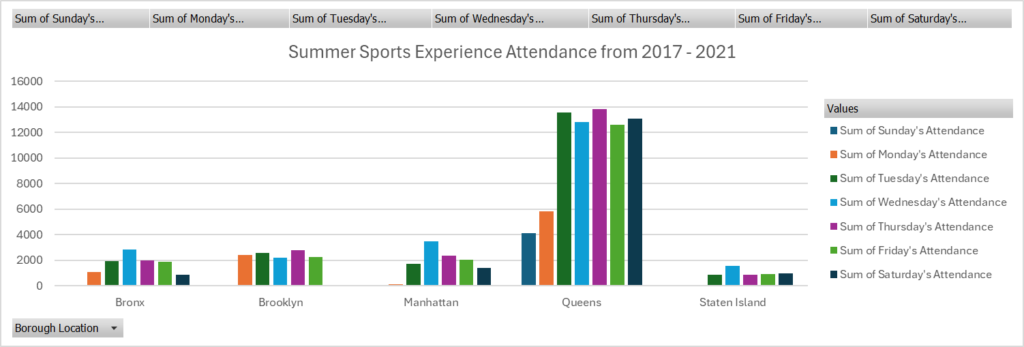
Graph made by Joel Lamonth, using Excel.
What trend did you identify?
The data I picked to analyze is from Summer Sports Experience out in New York. I noticed many trends while going through this data, the main one being that the Queens has the highest attendance across all days in the time period and is by far there most popular borough. And if you haven’t noticed already from looking at the graph, some locations don’t have data for them on some days, that is due to the location being closed on those days. Another trend I wanted to include because I feel like it is important to note, is that roughly for every location, attendance is relativity high for each borough in the midweek but when its inching towards the weekend, you can see a slight drop in attendance for those days, mainly taking Saturday as the key day for those drops.
What process did you go through to identify that trend?
The process I had to go through to identify the trends was a very organized approach. I first had to understand the data that I was dealing with, understanding that each column represented a specific day across the boroughs. After I understood the data, I observed the numbers and just by looking at it you can observe that one borough is doing better than all the other boroughs attendance-wise. For the other trend I noticed, I had to look at the day-to-day attendance analysis for each borough and realized that they all have a slight decline in numbers on the weekends and the pivot table and the graph really helped me see it clearly and I was able to identify it.
No responses yet